XAGUSD H4 – Consolidation

The XAGUSD is consolidating after distribution. The bullish structure is still intact around the support at 47.6. Here’s the full breakdown:
📊 Market Structure: Consolidation
📈 EMA Check (H4): Price closes below 50 EMA
🔑 Support & Resistance: Support = 47.6 / Resistance = 49.25
📏 Trendline: Uptrend line broken (not shown)
📐 Channel: Not available
✅ Bias: Consolidation
🎯 Setup Watch: Look for buy setup to enter if 49.25 can be broken forming HH
XAUUSD H4 – Consolidation

The XAUUSD has pulled back to 4,050 and consolidated. With the strong demand for gold, we look for the bullishness to continue if a HH forms with the 4,150 broken. Here’s the full breakdown:
📊 Market Structure: Consolidation
📈 EMA Check (H4): Price closed below 50 EMA.
🔑 Support & Resistance: Support = 4,050 / Resistance = 4,150
📏 Trendline: Not available
📐 Channel: Not available
✅ Bias: Consolidation
🎯 Setup Watch: Looking for bullish setup to buy if a HH is formed
AUDNZD H4 – Rally Continues?
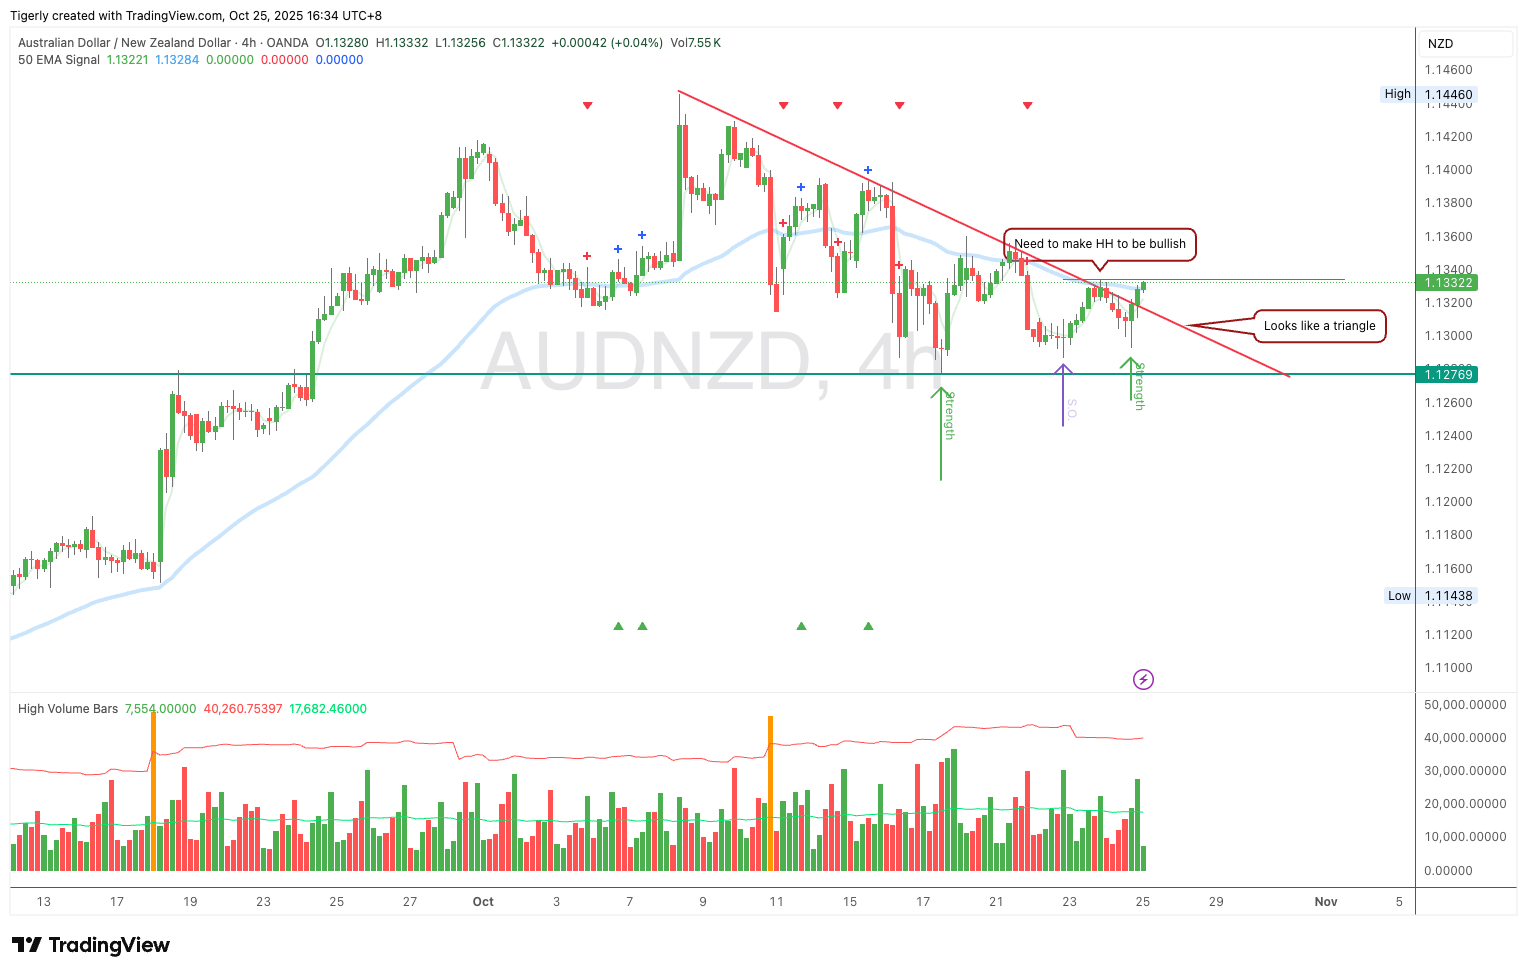
After consolidating for over 2 weeks, the AUDNZD has finally broken out of the bearish trend line. The demand is also shown around the support level. Here’s the full breakdown:
📊 Market Structure: Consolidation → Bullish
📈 EMA Check (H4): Price closed above 50 EMA
🔑 Support & Resistance: Support = 1.128 / Resistance = 1.144
📏 Trendline: Bearish trend line broken
📐 Channel: Not available
✅ Bias: Bullish
🎯 Setup Watch: Look for long setup to buy once a HH is formed
EURAUD H4 – Can The Support Hold?

EURAUD has been coiling in the tight range forming a descending triangle. If the support at 1.78 breaks, we expect the pair to turn bearish. Here’s the full breakdown:
📊 Market Structure: LL/LH → Bearish.
📈 EMA Check (H4): Price closed below 50 EMA
🔑 Support & Resistance: Support = 1.78 / Resistance = 1.79
📏 Trendline: Bearish trend line forming triangle with horizontal support
📐 Channel: Not available
✅ Bias: Consolidation but the bias is towards bearish
🎯 Setup Watch: Short if the support breaks. Else if the bearish trend line is broken, we may go long.
USDCAD H4 – Bearish?

USDCAD has been in distribution. If the 1.4 support level can be broken, it may turn bearish. Here’s the full breakdown:
📊 Market Structure: Distribution → Bearish
📈 EMA Check (H4): Price closed below 50 EMA
🔑 Support & Resistance: Support = 149.8 / Resistance = around 153
📏 Trendline: Not available
📐 Channel: Not available
✅ Bias: Towards bearish
🎯 Setup Watch: Look for short entry when the 1.4 support is broken.
USDCHF H4 – Bearish

The USDCHF has pulled back to the resistance level, which is also the bearish trend line. With the bearish price action, we believe this is a good short entry. Here’s the full breakdown:
📊 Market Structure: LL/LH → Bearish
📈 EMA Check (H4): Price is below 50 EMA
🔑 Support & Resistance: Support = 0.7829 / Resistance = 0.797
📏 Trendline: Bearish
📐 Channel: Not available
✅ Bias: Bearish
🎯 Setup Watch: Sell the rally.