XAGUSD H4 – Bullish Channel Holding
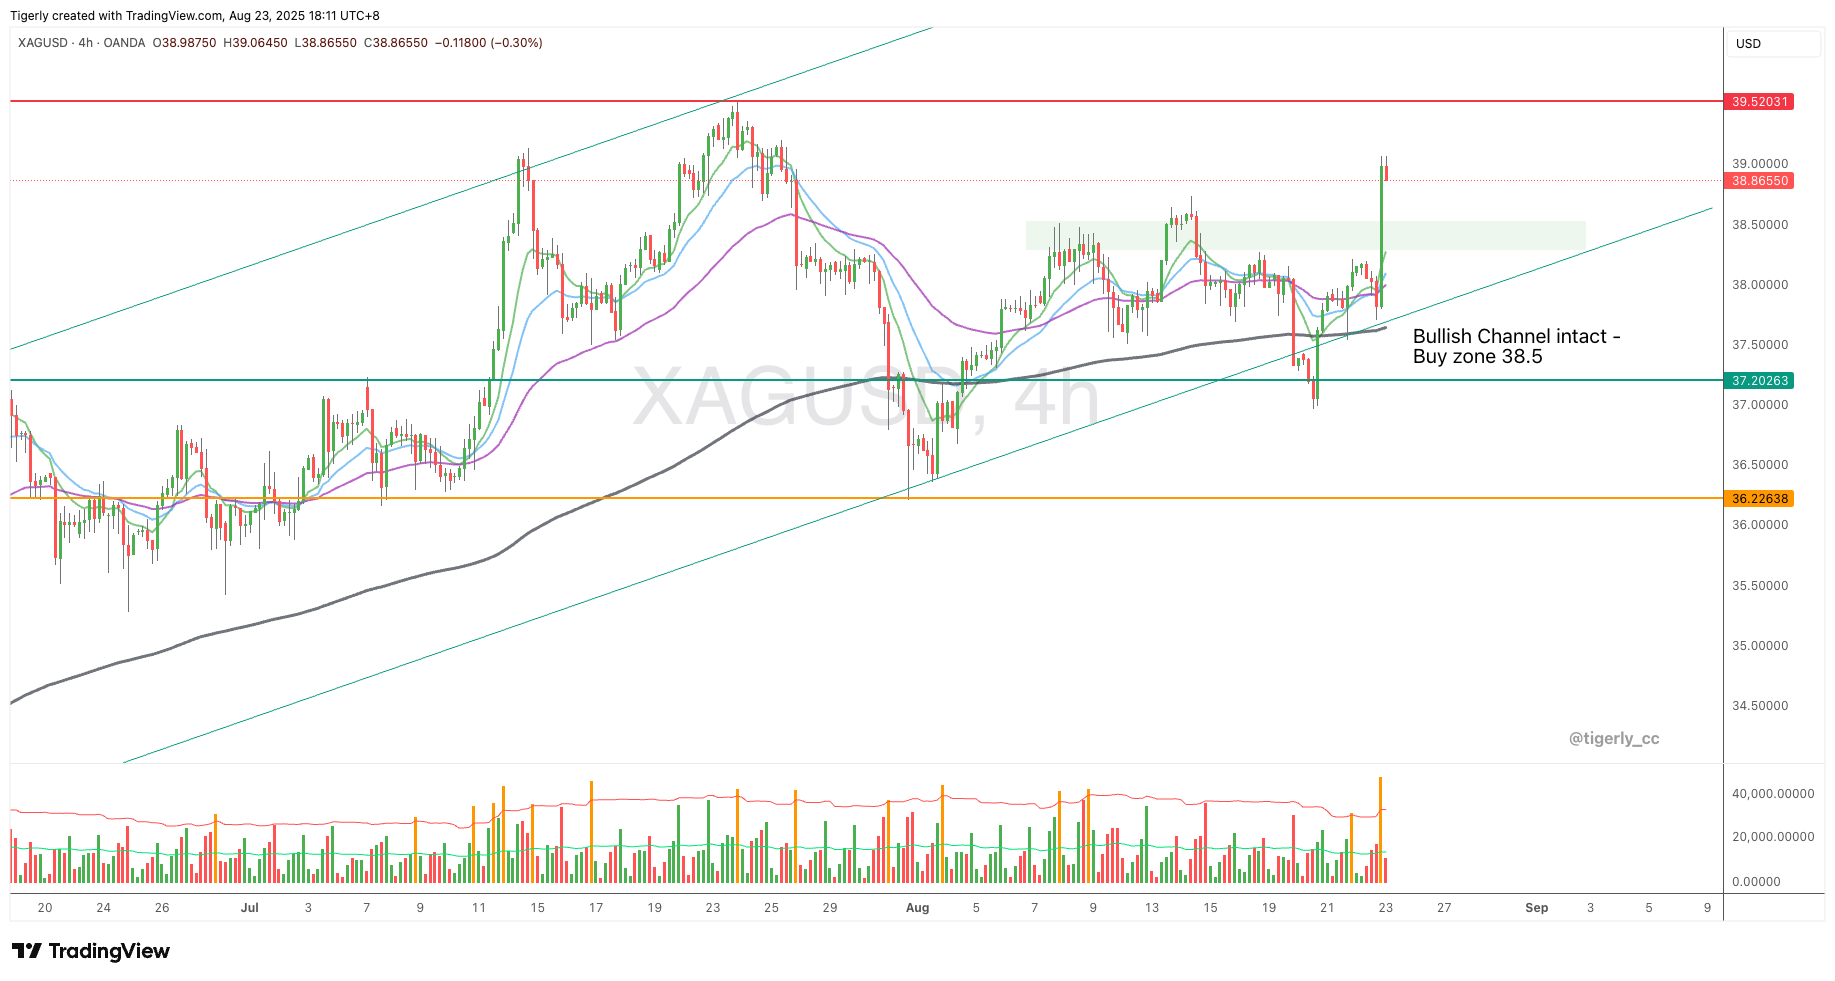
Today’s H4 analysis on XAGUSD highlights a bullish channel supported by higher highs and higher lows. Price action remains above the 50 and 200 EMA, with volume suggesting underlying strength, after the comment from Fed Chair Powell. Here’s the full breakdown:
📊 Market Structure: HH/HL → Uptrend
📈 EMA Check (H4): Price closes above 50 & 200 EMA
🔑 Support & Resistance: Support = 37.2 / Resistance = 39.5
📏 Trendline: Uptrend line intact
📐 Channel: Bullish channel still in play
🔥 Volume: Higher volume for bullish bars
✅ Bias: Bullish
🎯 Setup Watch: Buy pullback near 38.5 → TP 39.5
EURUSD H4 – Resistance Right On Top
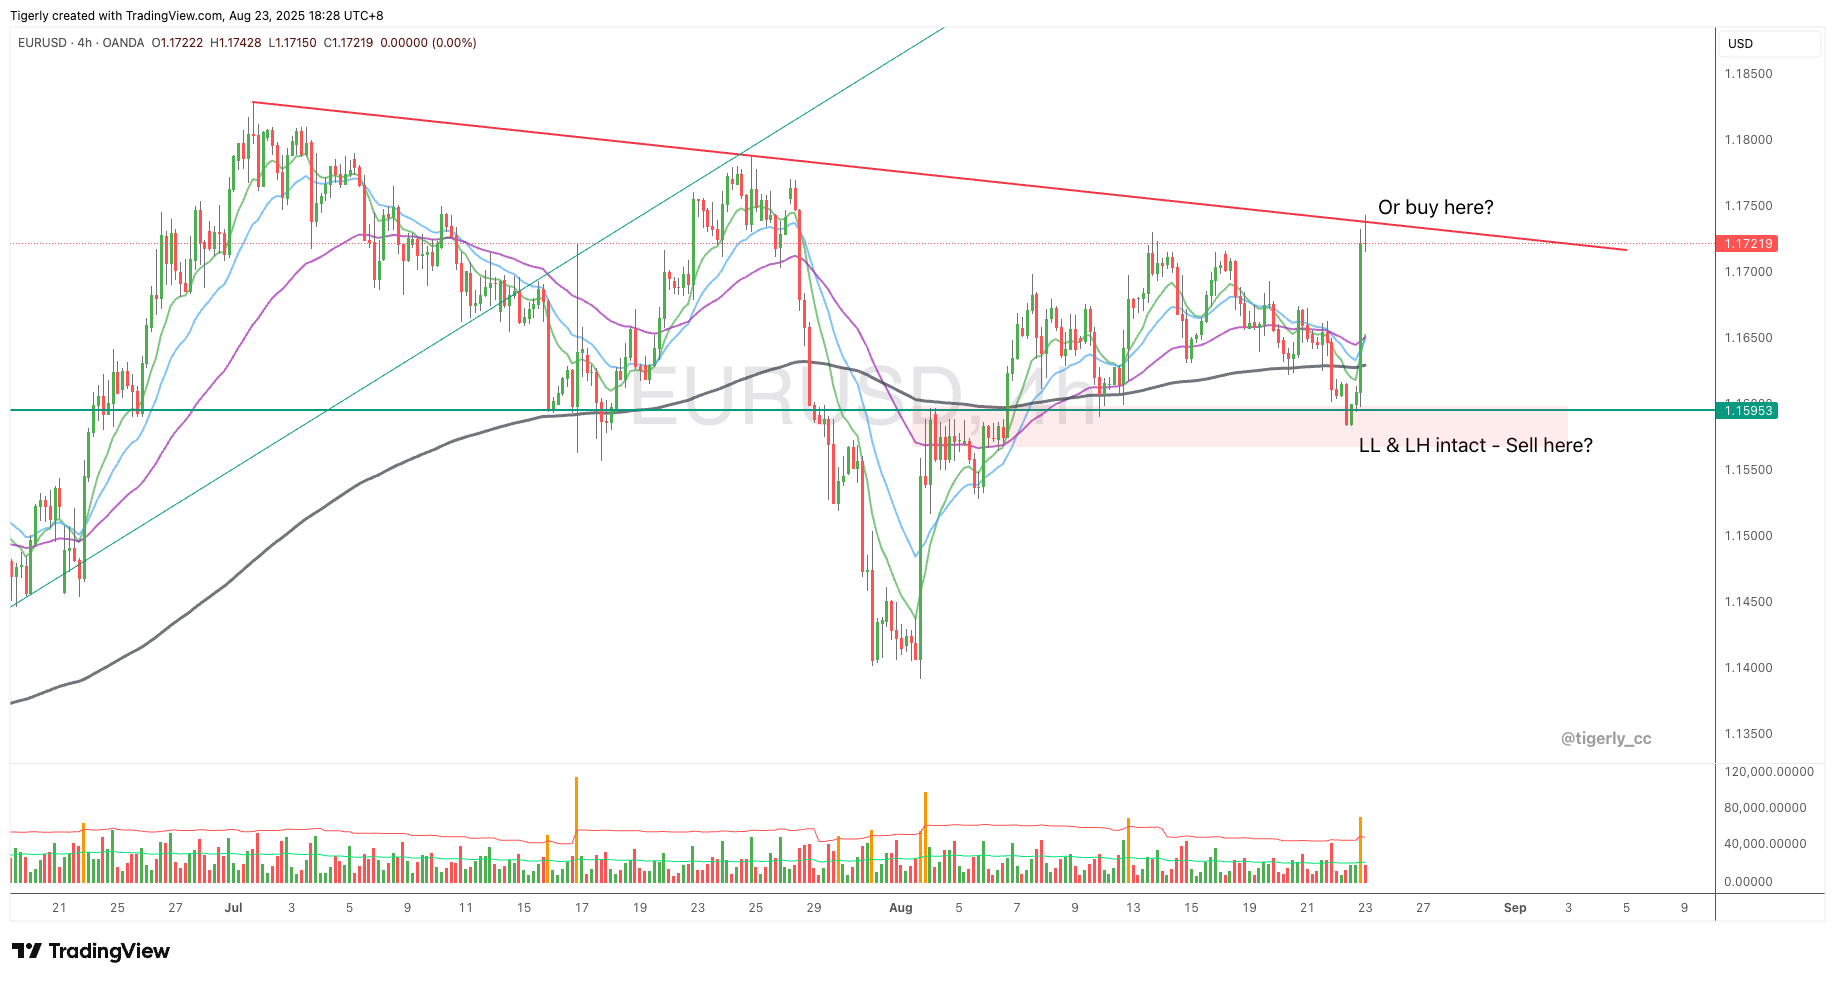
The market structure in H4 for EURUSD is still bearish bias with the LL and LH intact. The price action remains above the 50 and 200 EMAs, but it is capped by the down trend line. Here’s the full breakdown:
📊 Market Structure: LL/LH → Downtrend
📈 EMA Check (H4): Price closes above 50 & 200 EMA but oscillating around 200 EMA.
🔑 Support & Resistance: Support = 1.16 / Resistance = 1.1725
📏 Trendline: Downtrend line intact
🔥 Volume: Higher volume for bearish bars
✅ Bias: Bearish
🎯 Setup Watch: Sell breakout below 1.16 → TP 1.14
USDJPY H4 – Side Way Price Action Continues
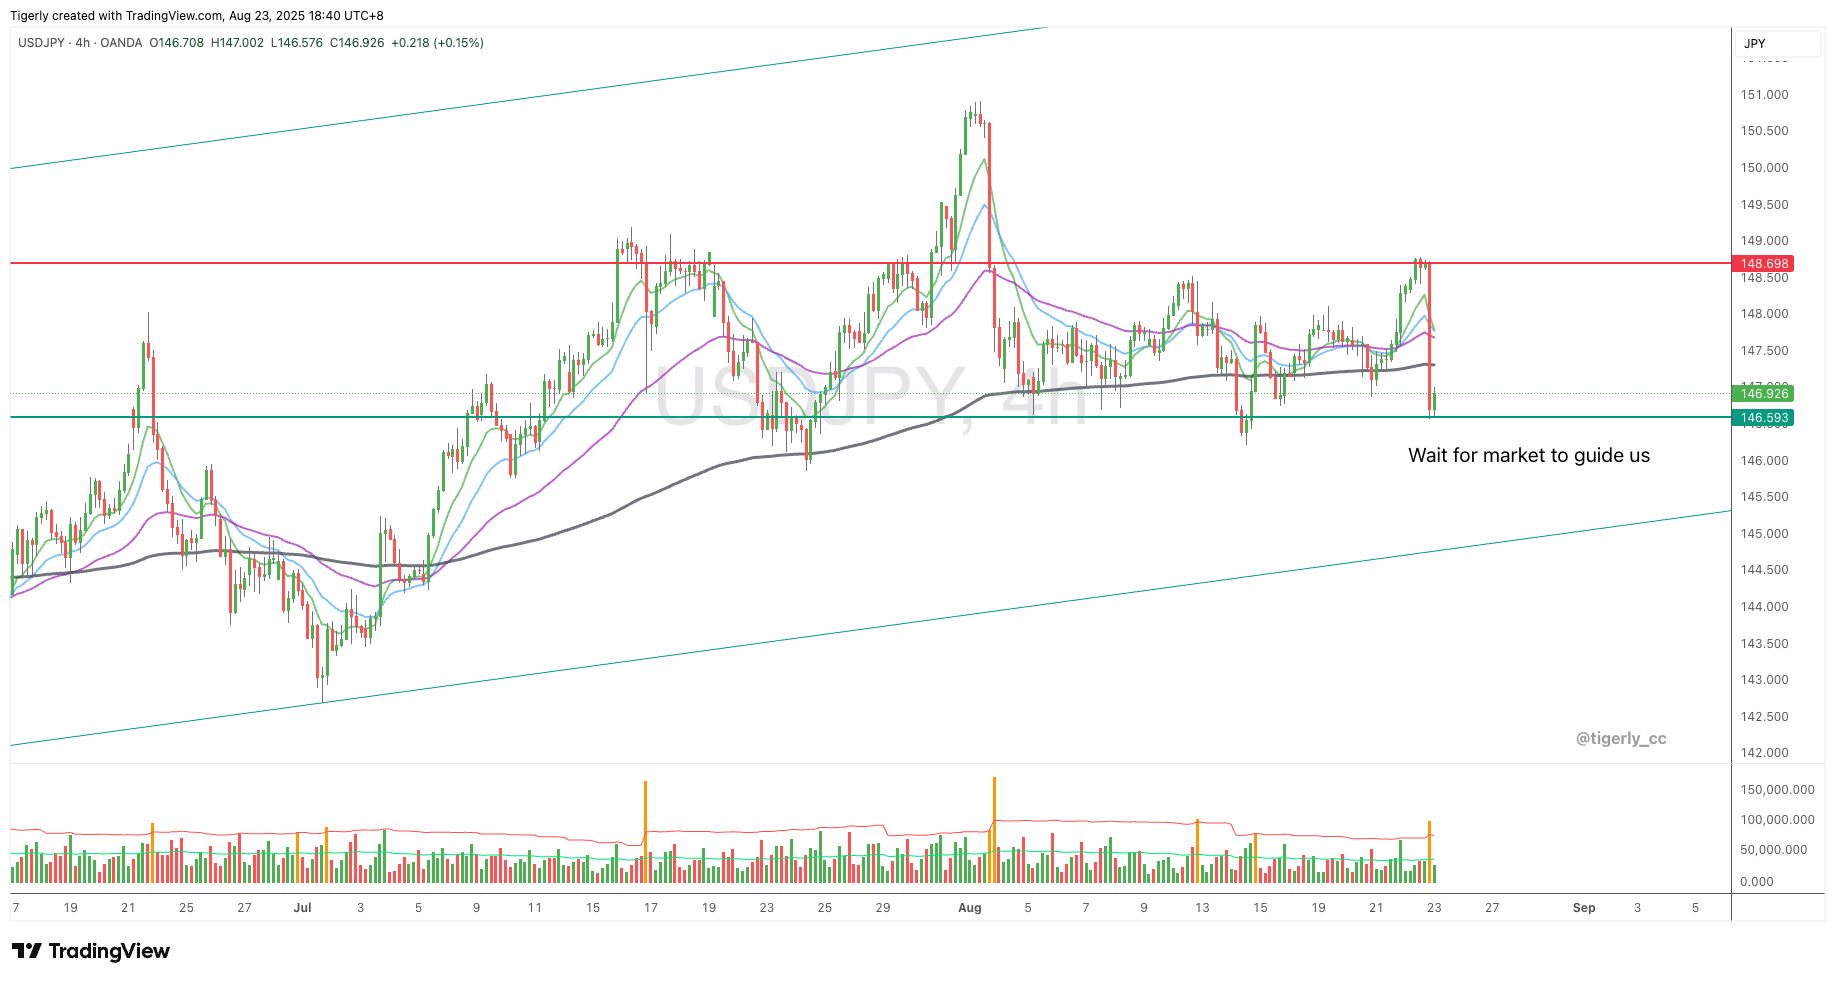
The USDJPY pair continue to oscillate between 146.6 to 148.7, not showing any bullishness despite the HH & HL structure. The H4 200 EMA is flat, showing indecisiveness of the market. Here’s the full breakdown:
📊 Market Structure: HH/HL → Sideway at the moment
📈 EMA Check (H4): Price oscillating around 200 EMA
🔑 Support & Resistance: Support = 146.6 / Resistance = 148.7
📏 Trendline: Uptrend line intact
📐 Channel: Bullish channel still in play
🔲 Pattern: Is H&S forming
✅ Bias: Neutral
🎯 Setup Watch: Wait for clean breakout either way
GBPUSD H4 – Bearish Structure Intact
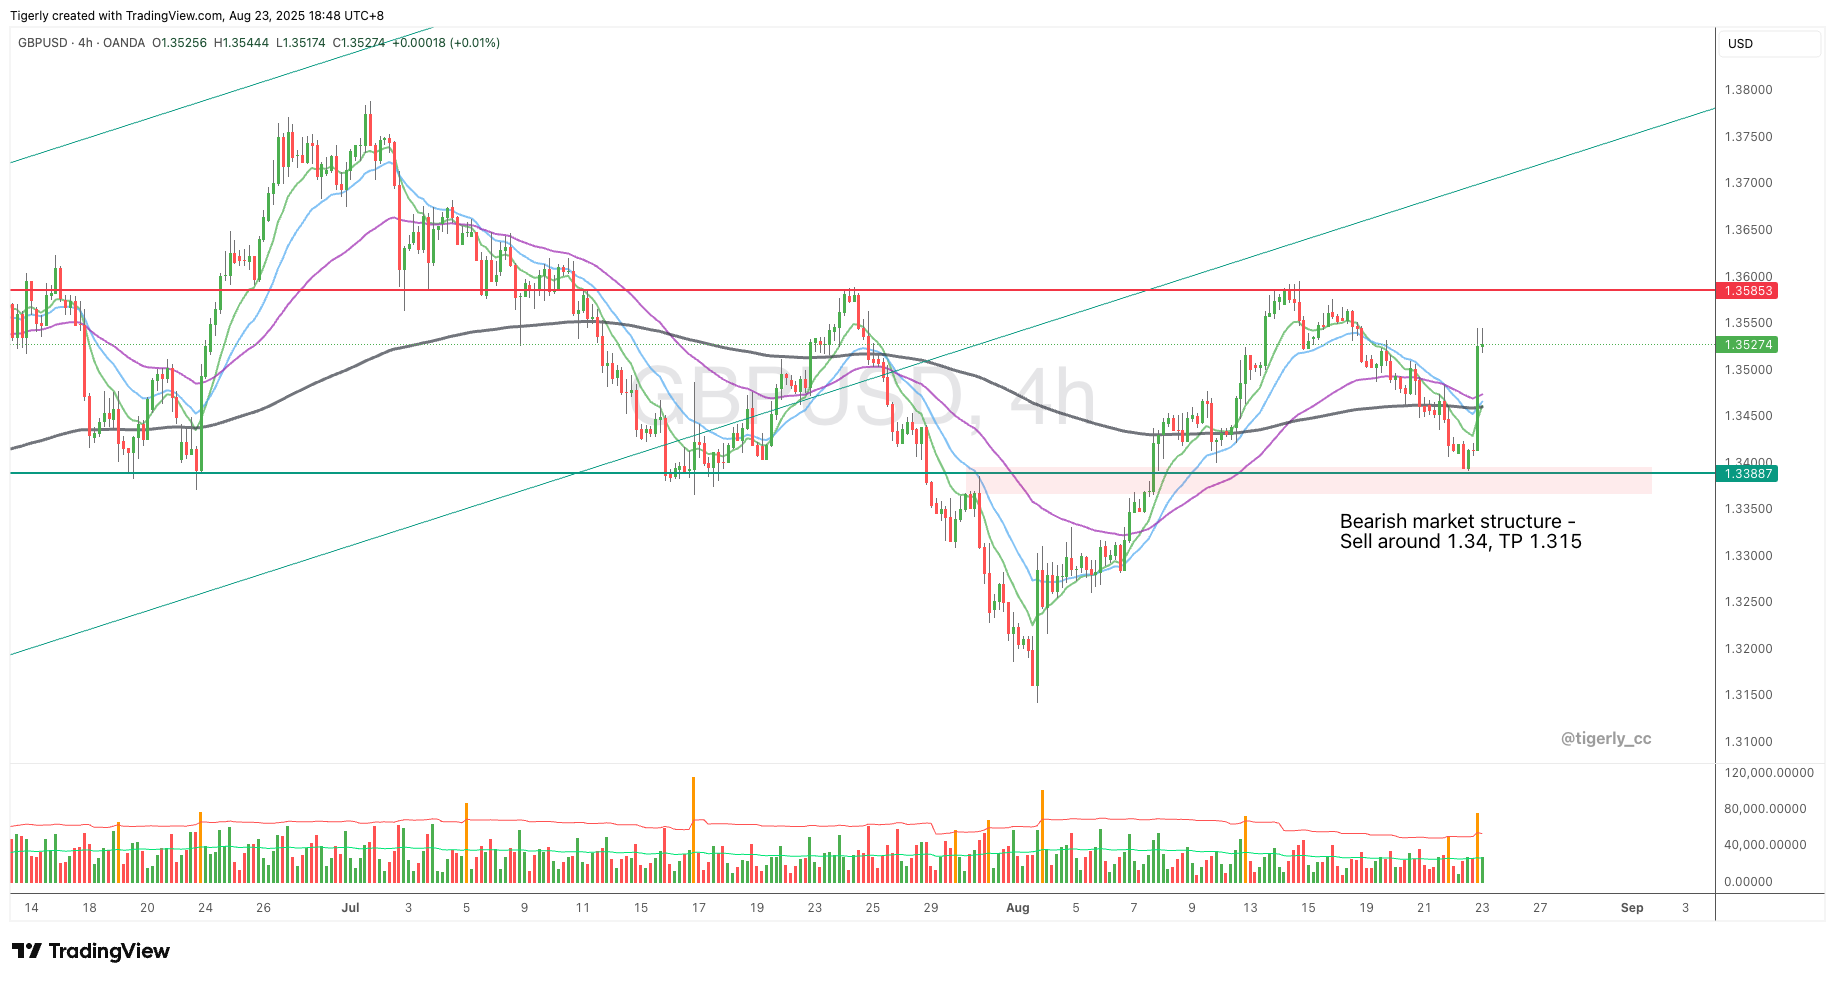
1.34 presents a strong support for GBPUSD. With the price surged last Friday, it closed above 50 and 200 EMAs. However, the LL & LH bearish structure is still intact. Here’s the full breakdown:
📊 Market Structure: LL/LH → Downtrend
📈 EMA Check (H4): Price closes above 50 & 200 EMA
🔑 Support & Resistance: Support = 1.34 / Resistance = 1.36
✅ Bias: Bearish
🎯 Setup Watch: Wait for clean breakout below 1.34 → TP 1.315
USDCAD H4 – Chance To Go Long
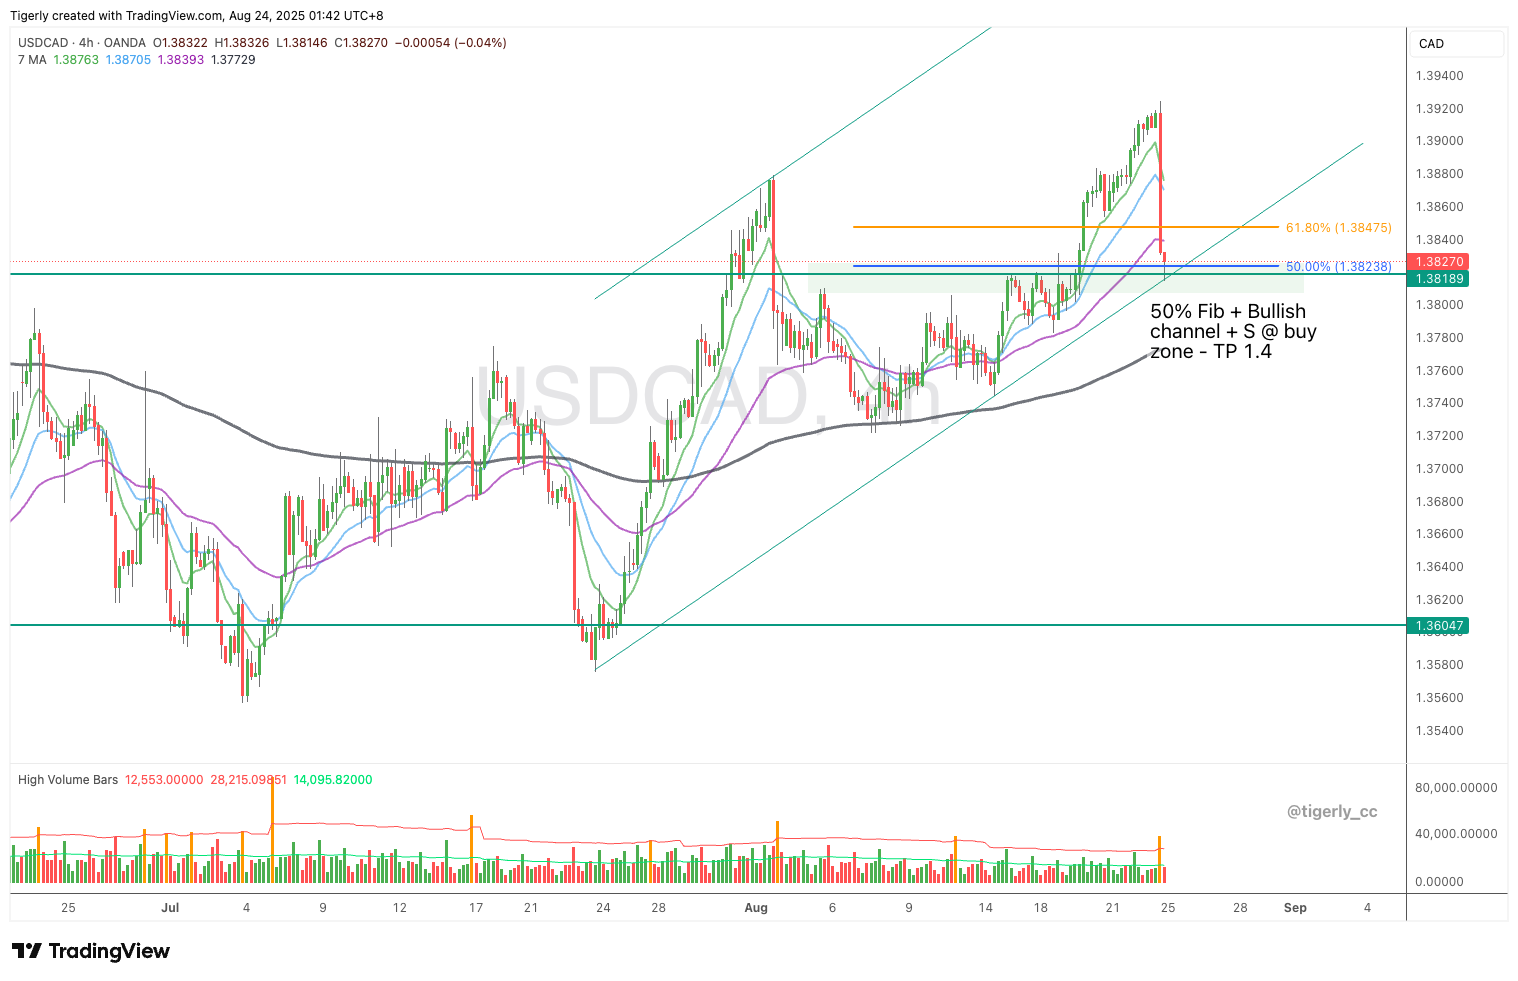
USDCAD maintains its bullish structure. It pulled back to 1.382 on Friday, which is a very strong multiple edge zone that presents an opportunity to go long. Here’s the full breakdown:
📊 Market Structure: HH/HL → Uptrend
📈 EMA Check (H4): Price closes above 200 EMA
🔑 Support & Resistance: Support = 1.382 / Resistance = 1.4
📏 Trendline: Uptrend line intact
📐 Channel: Bullish channel still in play
🕯️ Candlestick: Pin bar rejecting support
📌 Fibonacci: Retrace near 50% level
✅ Bias: Bullish
🎯 Setup Watch: Place stop order at 1.3835 → SL 1.3805 → TP 1.4