XAGUSD H4 – Bullish Run Continues
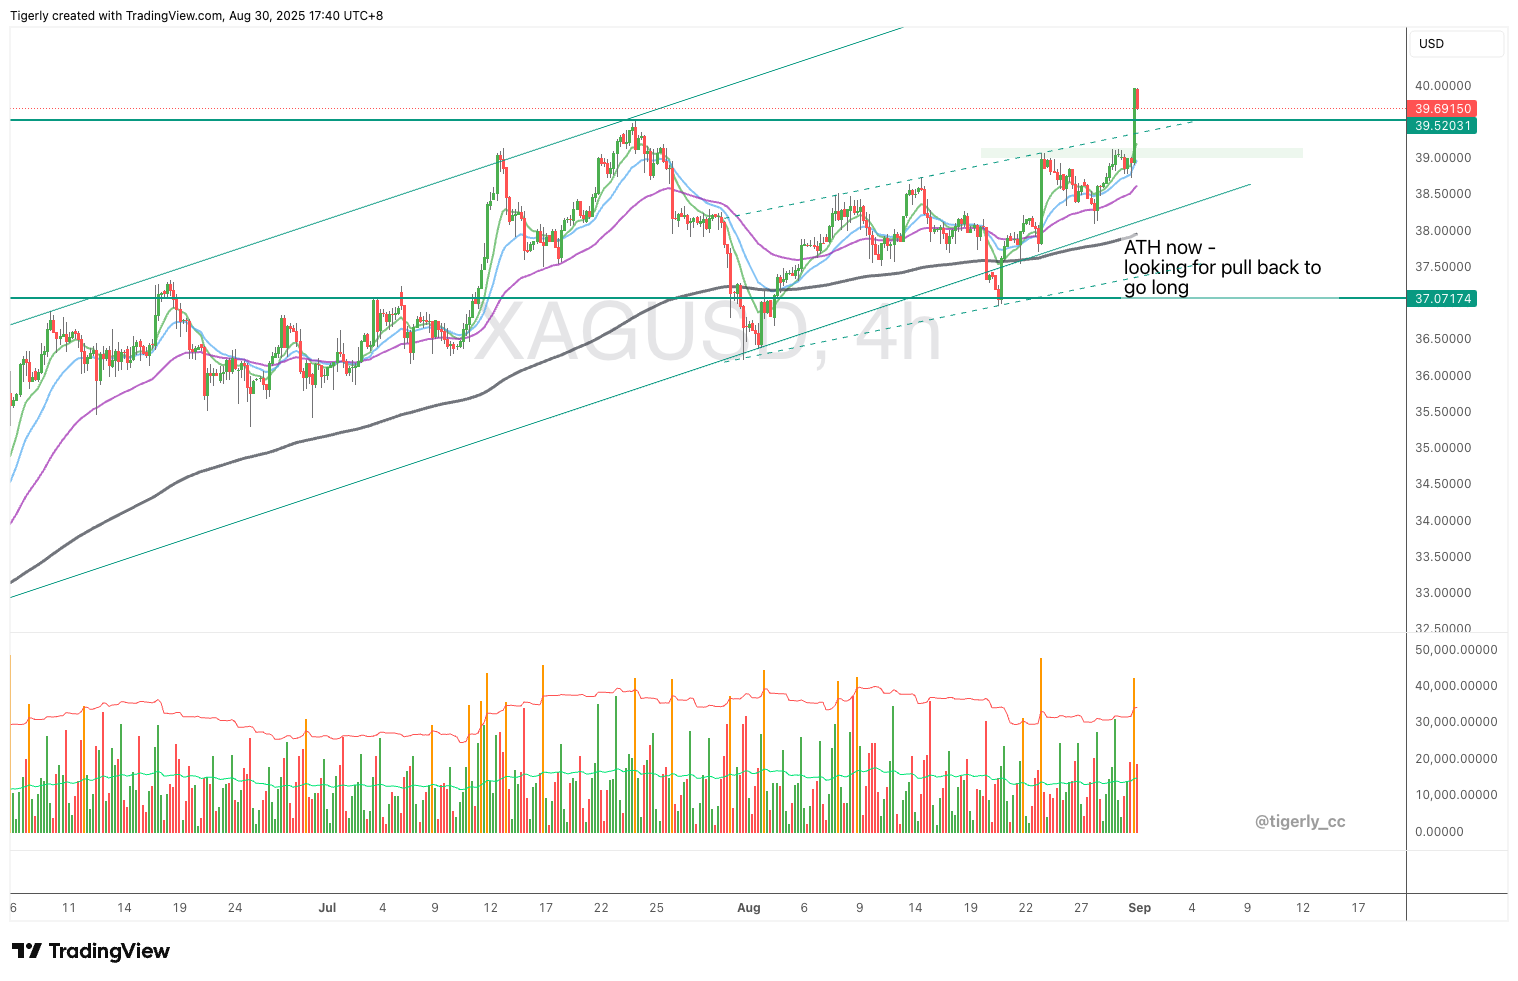
XAGUSD reaches all time high last Friday. We expect the bullish run to continue. Here’s the full breakdown:
📊 Market Structure: HH/HL → Bullish
📈 EMA Check (H4): Price closes above 50 & 200 EMA
🔑 Support & Resistance: Support = 39 / Resistance = 42 (Upper bullish channel)
📏 Trendline: Uptrend line intact
📐 Channel: Bullish channel still in play
🔥 Volume: Higher volume for bullish bars
✅ Bias: Bullish
🎯 Setup Watch: Buy pullback near 39 → TP 42
EURUSD H4 – Resistance Right On Top
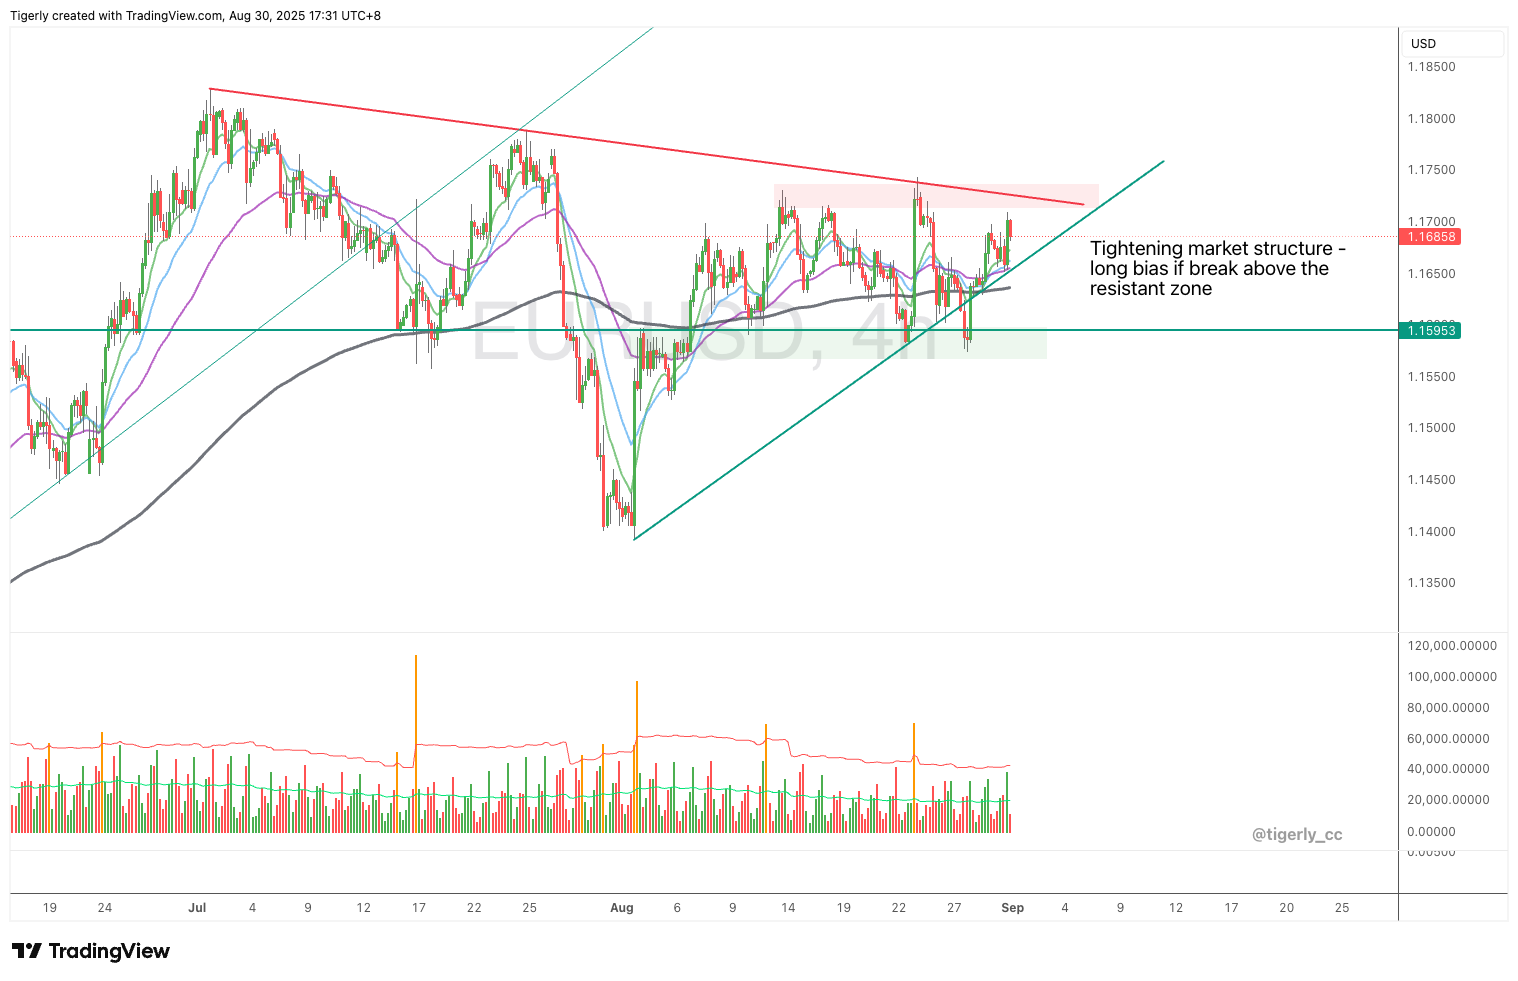
While the market structure in H4 for EURUSD is still bearish bias with the LL and LH intact. The price action last week has been moving between 1.16 and 1.17, forming a triangle. If EURUSD is able to break out clearly above the down trend line, we will be a buyer. Here’s the full breakdown:
📊 Market Structure: LL/LH → Bearish to Neutral. Turn bullish if 1.175 can be taken out.
📈 EMA Check (H4): Price closes above 50 & 200 EMA but oscillating around 200 EMA.
🔑 Support & Resistance: Support = 1.16 / Resistance = 1.175
📏 Trendline: Price tightening between the up and down trend line
✅ Bias: More to bullish
🎯 Setup Watch: Buy breakout above 1.175 → TP 1.2
USDJPY H4 – Side Way Price Action Continues
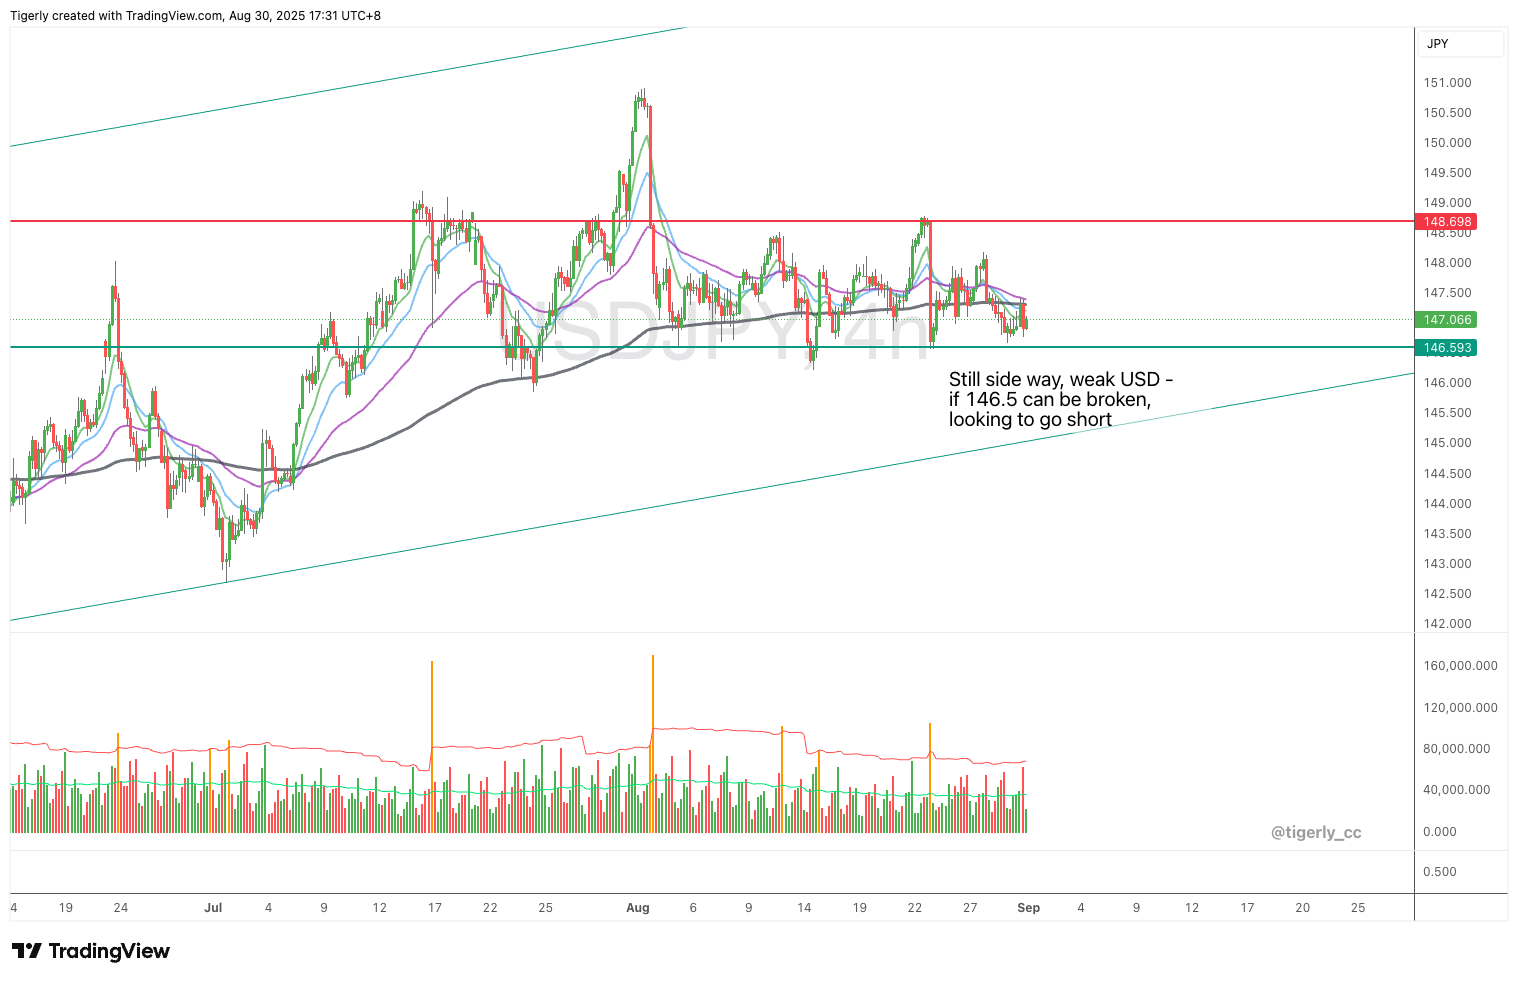
The USDJPY pair continue to oscillate between 146.6 to 148, not showing any bullishness despite the HH & HL structure. The H4 200 EMA is flat, showing indecisiveness of the market. Here’s the full breakdown:
📊 Market Structure: HH/HL → Sideway at the moment
📈 EMA Check (H4): Price oscillating around 200 EMA
🔑 Support & Resistance: Support = 146.6 / Resistance = 148
📏 Trendline: Uptrend line intact
📐 Channel: Bullish channel still in play
🔲 Pattern: Is H&S forming?
✅ Bias: Neutral
🎯 Setup Watch: Wait for clean breakout either way
GBPUSD H4 – Price Tightening
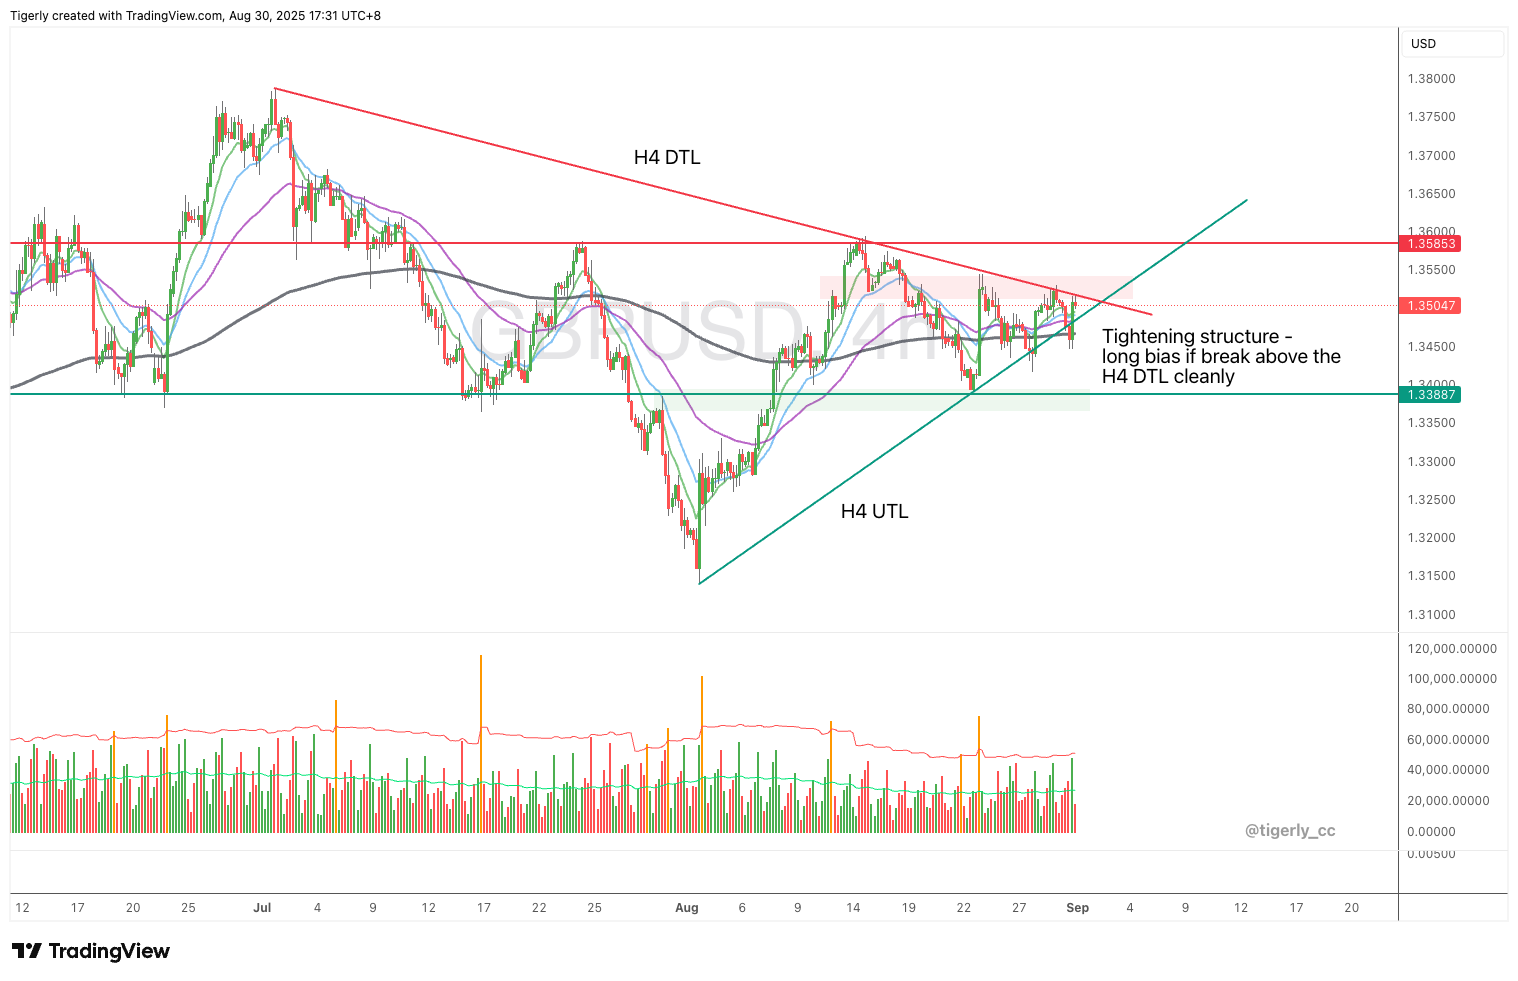
A triangle price pattern has formed for GBPUSD. The price is moving between 1.342 and 1.352, sandwiched between the down and up trend line. Here’s the full breakdown:
📊 Market Structure: LL/LH → Bearish to Neutral. Bullish if 1.355 can be taken out.
📈 EMA Check (H4): Price closes above 50 & 200 EMA
🔑 Support & Resistance: Support = 1.34 / Resistance = 1.36
✅ Bias: More to bullish
🎯 Setup Watch: Wait for clean breakout below 1.355 → TP 1.4
USDCAD H4 – Buyers Disappeared
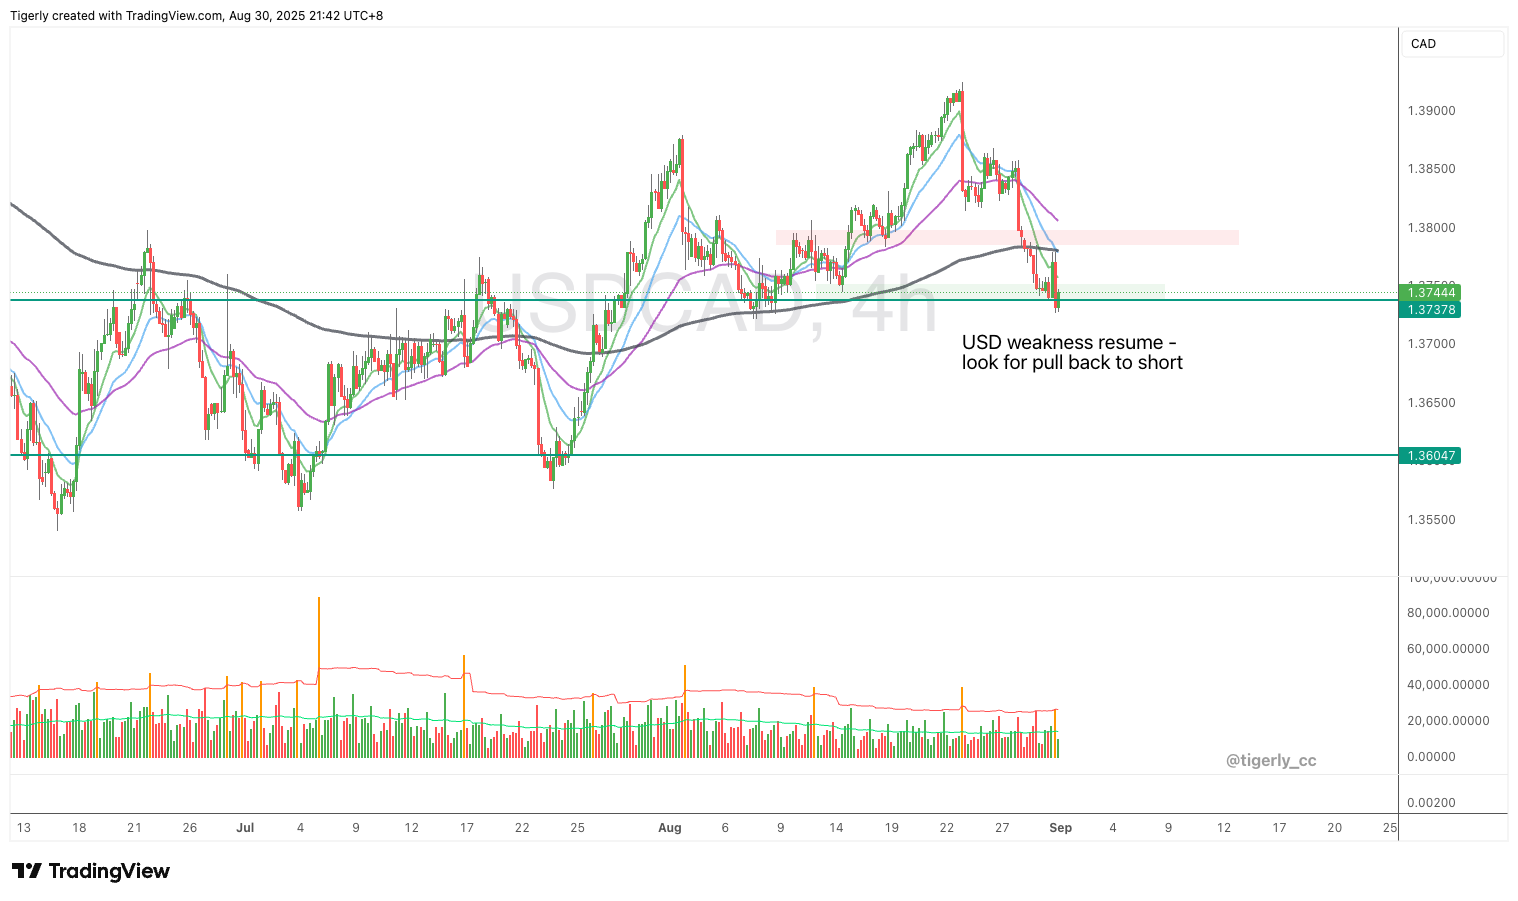
USDCAD closed below the 200 H4 EMA with the buyers outnumbered by sellers. The support zone around 1.38 was taken out clearly. Here’s the full breakdown:
📊 Market Structure: HH/HL → Bullish to Neutral. Turn bearish if 1.374 support is broken.
📈 EMA Check (H4): Price closes below 200 EMA
🔑 Support & Resistance: Support = 1.374 / Resistance = 1.38
✅ Bias: More to bearish
🎯 Setup Watch: Sellat 1.38 → SL 1.385 → TP 1.36