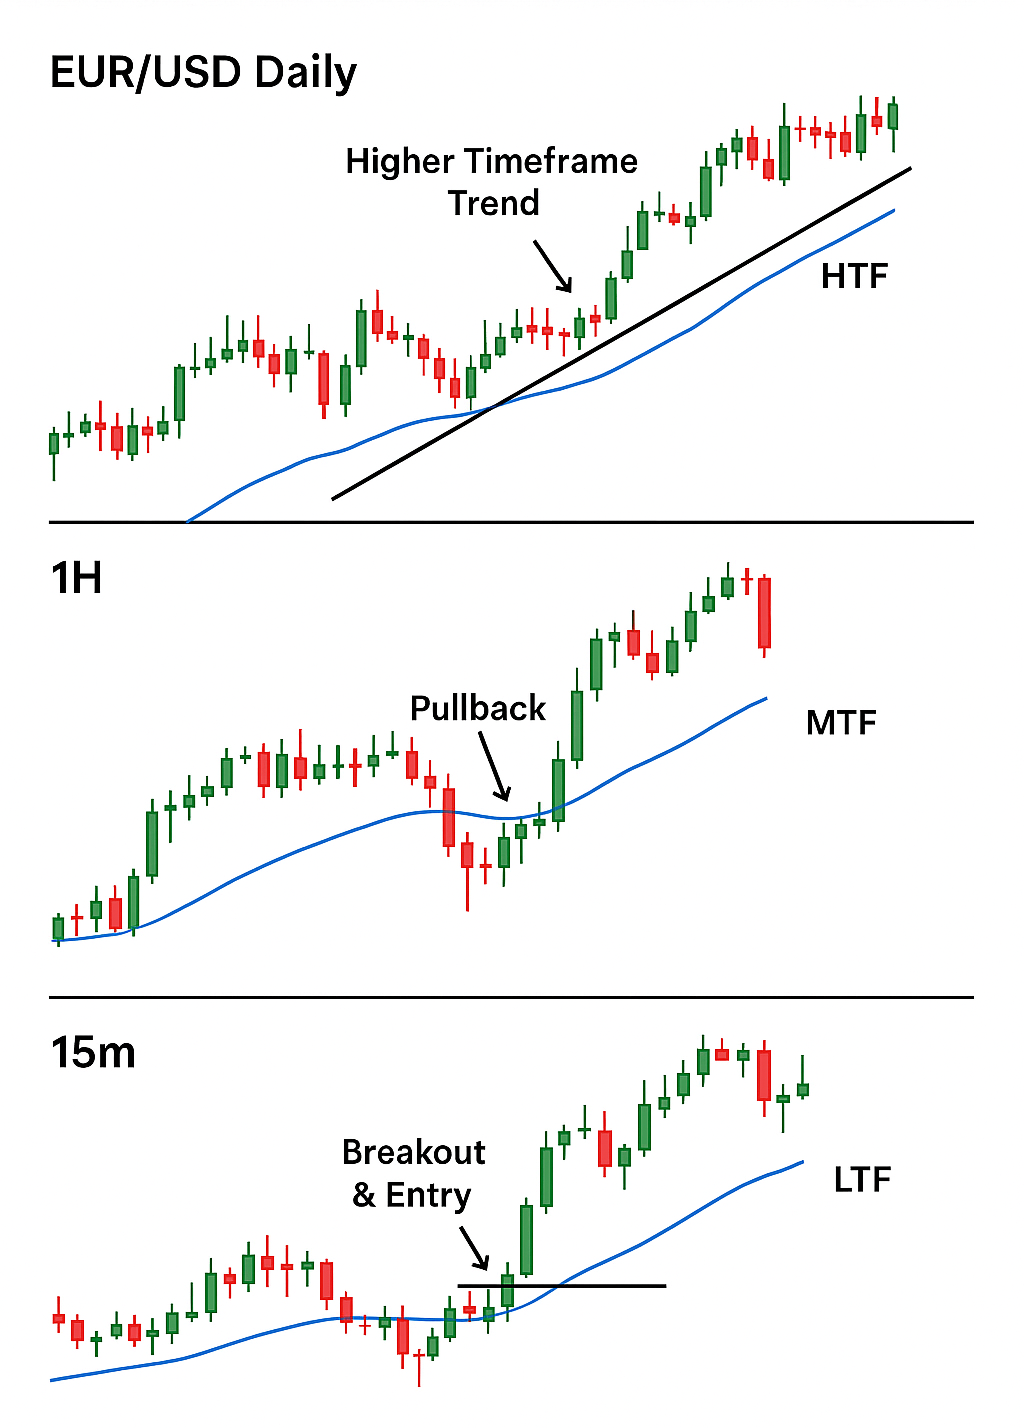
Multi-timeframe trend analysis
🧠 Key idea: Use higher timeframes to define the trend, and lower timeframes to fine-tune your entries.
| Level | Purpose | Example TF |
|---|---|---|
| HTF (Higher Timeframe) | Identify the dominant market direction | Daily, 4H |
| MTF (Middle Timeframe) | Spot setups & structure | 4H, 1H |
| LTF (Lower Timeframe) | Time precise entries | 1H, 15min, 5min |
- Higher highs & higher lows (uptrend)
- Lower highs & lower lows (downtrend)
- Consolidation zones or range boundaries
- Trendlines and 50/200 EMA orientation
- Pullbacks to a key moving average (20, 50 EMA)
- Bullish or bearish engulfing candles at trend continuation zones
- Consolidation near support/resistance ready to break
🎯 Example: On the 1H chart, price pulls back to the 50 EMA and forms a bullish engulfing candle in an uptrend.
- Minimize risk with tighter stops
- Avoid entering too early
- Get better R:R potential
- Breakout above a micro-resistance
- Bullish price action patterns
- MACD crossover or RSI bounce in trend direction

